jamovi Articles
Data Analysis | Descriptives
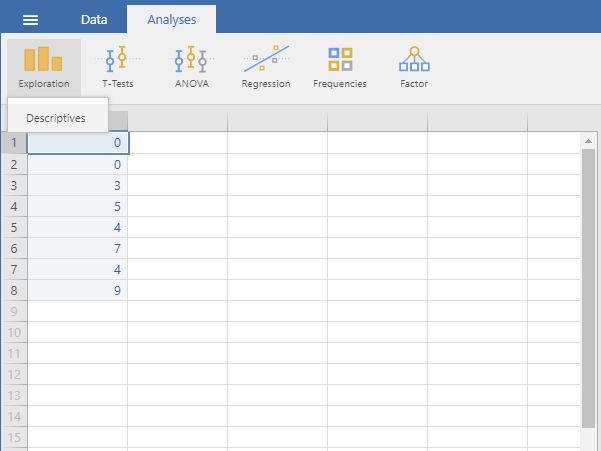
Selecting the Analysis
-
First, enter the data (described elsewhere).
-
On the “Analyses” tab, select the “Exploration -> Descriptives” option.
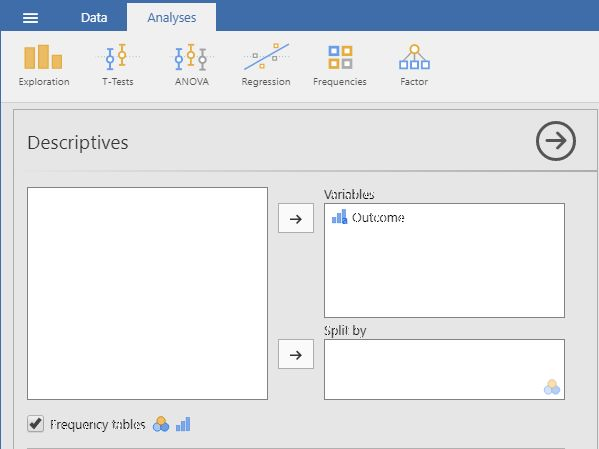
Obtaining Frequencies
-
A set of options will then appear for you to choose the variables and statistics of interest.
-
Select the variables you wish to analyze by clicking on them in the lefthand box and then the arrow to move them into the righthand box.
-
Be sure that “Frequency tables” is checked. Without this checked, you will not get a frequency distribution.
-
Output will automatically appear on the right side of the window.
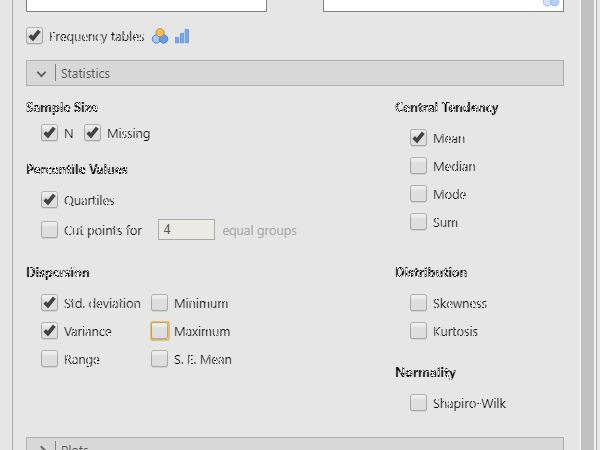
Obtaining Descriptive Statistics
-
Though some basic summary statistics are displayed by default, you can make changes by expanding the “Statistics” dropdown menu.
-
As you select the desired statistics, the output on the right side of the window will be automatically updated.