Basic Statistical Methods for Social Science
Sourcebook is an online textbook that is intended to facilitate the connection between standard introductory statistics concepts and their implementation in statistical software.
Learning Goals
The Sourcebook materials are organized to facilitate both applied data analysis and teaching, making it suitable for classroom instruction, self-study, and research support. With these materials, users should be able to:
- Choose and implement the appropriate analyses given the research design
- Demonstrate the connections between formulas, calculations, and computer output of analyses
- Summarize and interpret statistical analyses in correct APA style

Included Materials
This Sourcebook contains a wide range of materials designed to assist with the use of statistical software such as IBM SPSS, jamovi, JASP, R (base functions), EASI (an R package), and CREATE (a collection of Excel spreadsheets). To that end, it contains:
- Instructions and screenshots that show how to enter data in the software packages
- Instructions and screenshots that show how to navigate and analyze the data in the software packages
- Screenshots that show the software packages’ output and annotations with interpretation
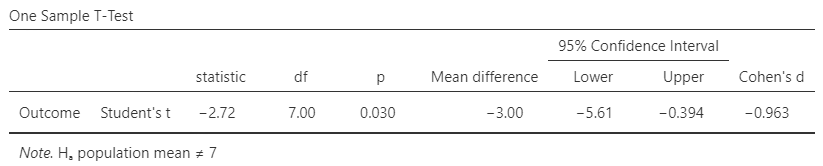
Statistical Significance: The t statistic is the ratio of the mean difference (raw effect) to the standard error of the mean.
\[t = \frac{M_{DIFF}}{SE_M} = \frac{-3.000}{1.102} = -2.722\]With df = 7, p = .030. This would be considered a statistically significant finding.
Confidence Interval: For this design, the appropriate confidence interval is around (centered on) the mean difference (raw effect).
\[CI_{DIFF} = M_{DIFF} \pm (t_{CRITICAL} ) (SE_M) = -3.000 \pm (2.365) (1.102) = [ -5.606, -0.394 ]\]Thus, the researcher concludes that the true population mean difference is somewhere between -5.606 and -0.394 (knowing that the estimate could be wrong).
Effect Size: Cohen’s d Statistic provides a standardized effect size for the mean difference (raw effect).
\[d = \frac{M_{DIFF}}{SD} = \frac{-3.000}{3.117} = -0.963\]Given Cohen’s heuristics for interpreting effect sizes, this would be considered a large effect.
Sourcebook Websites
Sourcebook Sections
- Intro Articles
- Examples Articles
- SPSS Articles
- jamovi Articles
- JASP Articles
- R Articles
- EASI Articles
- CREATE Articles