SPSS Articles
Data Analysis | Confidence Interval for a Mean
Selecting the Analysis
-
First, enter the data (described elsewhere).
-
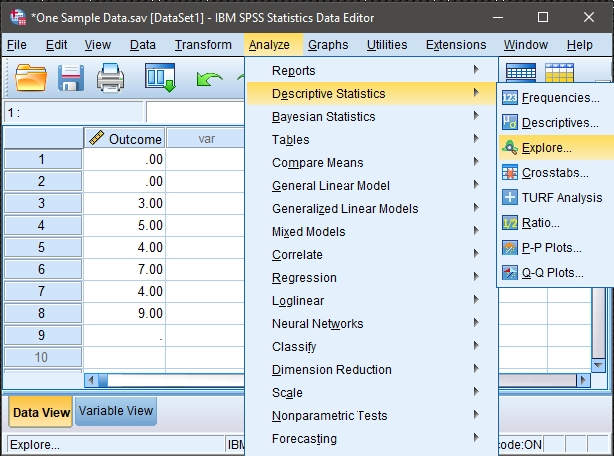
After the data are entered, select the “Analyze → Descriptive Statistics → Explore” option from the main menu.
Obtaining the Exploratory Statistics
-
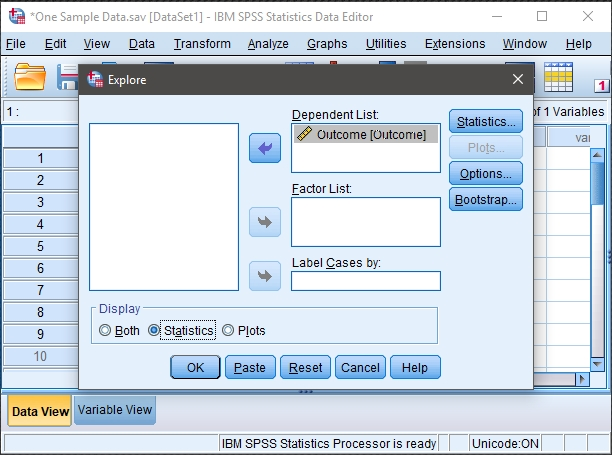
A dialogue box will then appear for you to choose the variables of interest.
-
Select the variables you wish to analyze by clicking on them and hitting the arrow to move them into the “Dependent List” box.
-
Be sure that “Statistics” is checked. This will limit your output to basic descriptive statistics and confidence intervals.
-
If you do not wish to alter the default (95%) confidence level, click “OK.” A separate window with the output will appear.
Altering the Confidence Interval
-
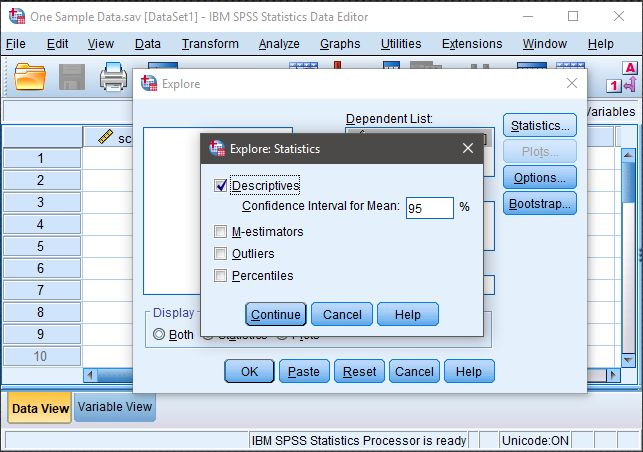
If you wish to alter the width of the confidence interval, select the “Statistics” button.
-
Another dialogue box will appear where you can change the confidence level. When you are done, click “Continue.” This will return you to the original dialogue box.
-
After clicking on “OK” in the original dialogue box, a separate window with the output will appear.
Intro Articles
SPSS Articles
- Data Entry | One Sample Data
- Data Analysis | Confidence Interval for a Mean
- Annotated Output | Confidence Interval for a Mean