SPSS Articles
Annotated Output | Confidence Interval for a Mean
Computer Output
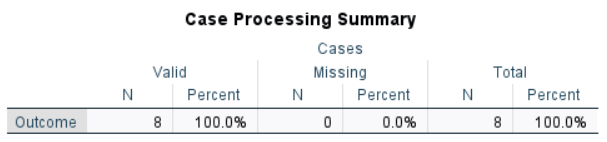
The table of descriptive statistics provides the baseline information.
The table of inferential statistics shows the key elements to be interpreted.
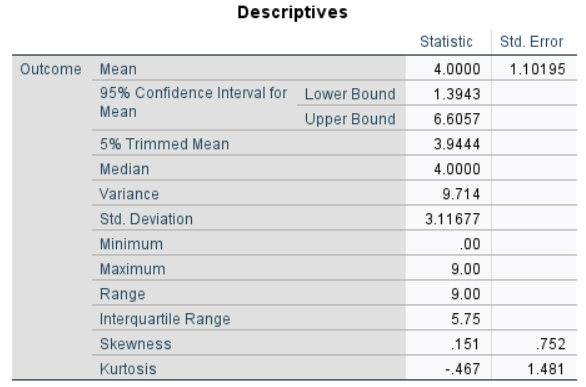
These values of the descriptives are identical to the values that would be provided by the “Descriptives” procedure.
Using the “confidence interval”, the researcher concludes that the true population mean is likely between 1.394 and 6.606 (knowing that the estimate could be incorrect).
APA Style
Confidence intervals provide a range estimate for a population value (e.g., the mean). Note that the width of the interval can be altered to reflect the level of confidence in the estimate.
The participants (N = 8) scored low on the Outcome (M = 4.00, SD = 3.12), 95% CI [1.39, 6.61].