SPSS Articles
Data Analysis | Frequencies
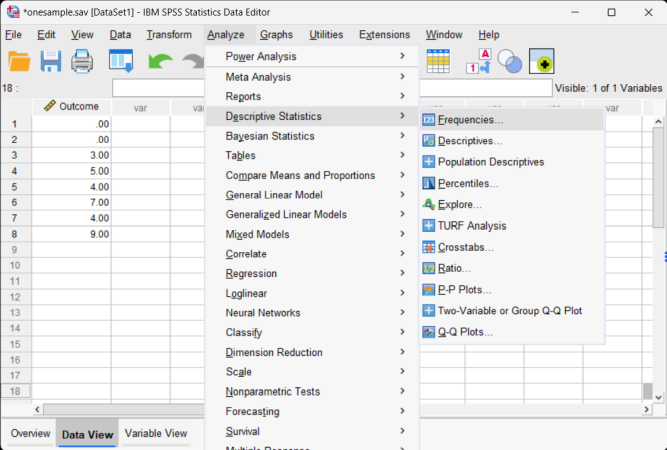
Selecting the Analysis
-
First, enter the data (described elsewhere).
-
After the data are entered, select the “Analyze → Descriptive Statistics → Frequencies” option from the main menu.
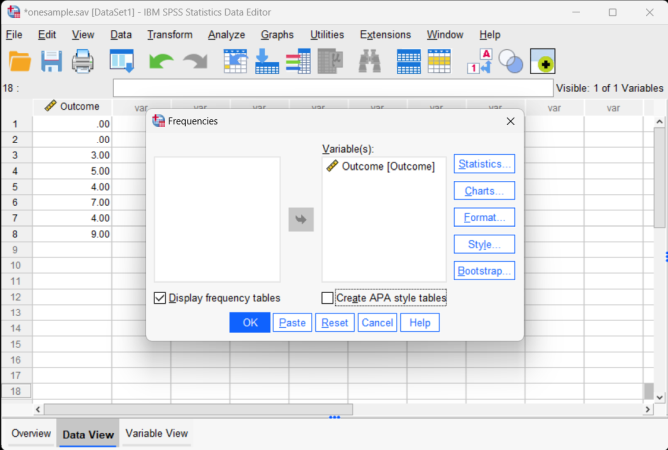
Obtaining Frequencies
-
A dialogue box will then appear for you to choose the variables of interest.
-
Select the variables you wish to analyze by clicking on them and then the arrow to move them into the “variables” box.
-
Be sure that “Display frequency tables” is checked. Without this checked, you will not get a frequency distribution.
-
If all you wish is a frequency table (with no histogram or summary statistics), click “OK.” A separate window with the output will appear.
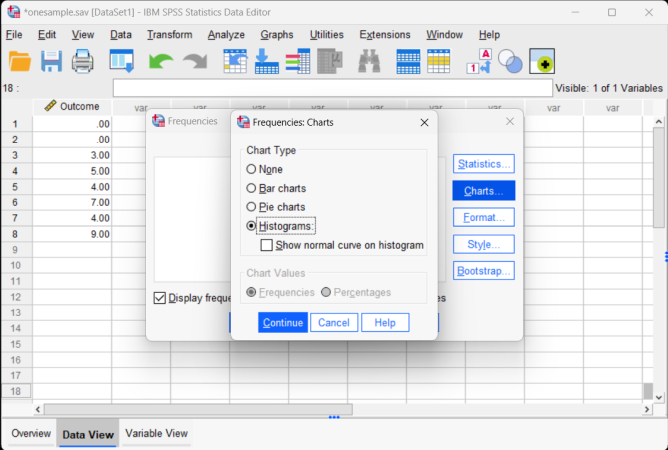
Obtaining a Histogram
-
To obtain a histogram, click on the “Charts” button. Another dialogue box will appear.
-
In this box, select “Histogram.”
-
Click “Continue.” This will return you to the original dialogue box.
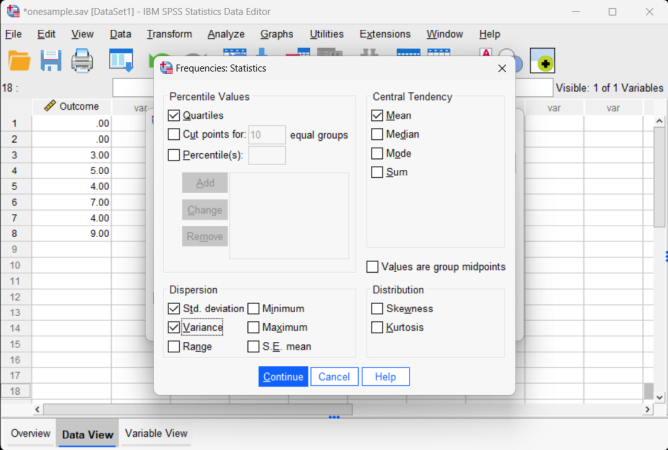
Obtaining Descriptive Statistics
-
To obtain summary statistics, select “Statistics.” Another dialogue box will appear.
-
In this box, you can request that SPSS calculate the median and quartiles.
-
Once you have selected the desired statistics, click “Continue.” This will return you to the original dialogue box.
-
After clicking on “OK” in the original dialogue box, a separate window with the output will appear.