SPSS Articles
Annotated Output | Paired Samples t Test
Computer Output
The table of descriptive statistics can be used to determine the inferential statistics.
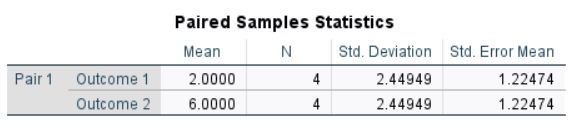
The descriptive statistics are calculated separately for each instance (which are shown as separate variables).
The table of inferential statistics shows the key elements to be calculated.

Here, t = -3.266 and p = .047. This would be considered a statistically significant finding.
Using “CI for Mean Difference”, the researcher estimates that the true population mean difference is somewhere between -7.898 and -0.102 (knowing that the estimate could be wrong).
Cohen’s d = -1.633. Given Cohen’s heuristics for interpreting effect sizes, this would be considered an extremely large effect.
APA Style
For this analysis, the differences between two measurements on one set of people are being compared. Thus, the summary and the inferential statistics focus on that difference.
A paired samples t test showed that the difference in Outcome scores (N = 4) between the first time point (M = 2.00, SD = 2.45) and second time point (M = 6.00, SD = 2.45) was very large and statistically significant, t(3) = -3.27, p = .047, 95% CI [-7.90, -0.10], d = -1.63.
Alternatively, the means, standard deviations, and confidence intervals could be presented in a table or figure associated with this text.