JASP Articles
Data Analysis | Standardized Scores
Selecting the Analysis
-
First, enter the data (described elsewhere).
-
In the “Edit Data” section of the menu, click on the green “+” sign in the last column. A new box will pop up for you to define the variable.
Computing Transformations
-
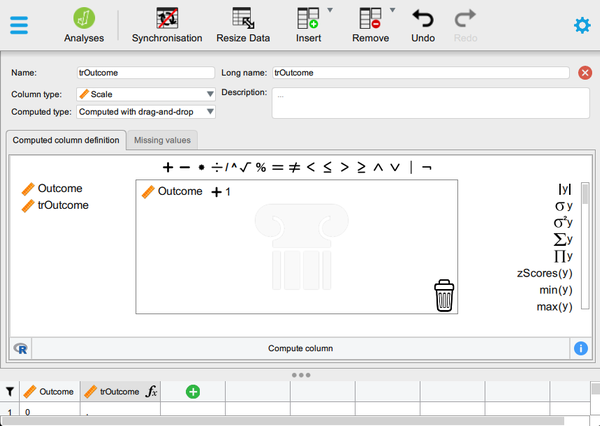
Type in the new you wish to give the new variable (here it is “trOutcome”). Hit “Enter” to be sure the rest of the cells populate.
-
For “Computed Type”, be sure to select “Computed with Drag and Drop”.
-
In the tab labeled “Computed Column Definition”, drag your original variable (here “Outcome”) to the main box. Click on the math operator (here “+”) and then click on the dots (and type your number).
-
Click on “Compute Column” to finalize the data transformation.
-
To hide the setup menu, click on the large red “X”.
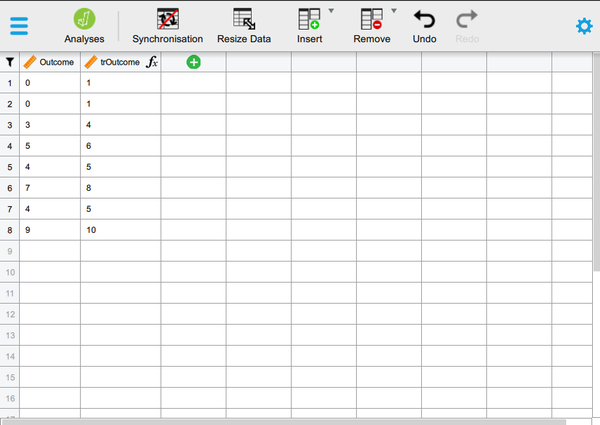
Viewing Transformed Scores
-
Note that transformed variables are not included in the output. Rather, they are saved as new variables in the data view window.
-
These variables can be used in subsequent analyses. You can follow the previous tutorials to get descriptive statistics for these variables.
Obtaining Standardized Scores
-
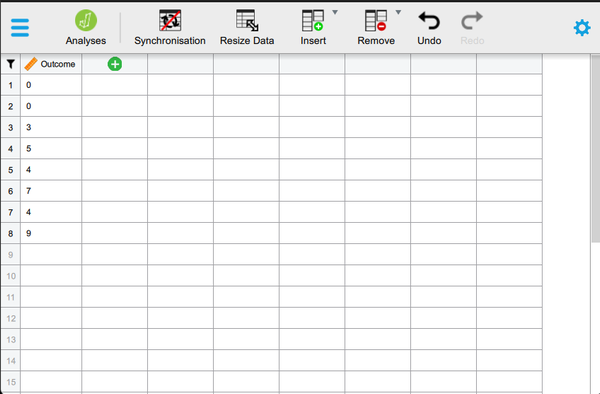
In addition, you can obtain standardized scores. First, enter the data (described elsewhere).
-
In the “Edit Data” section of the menu, click on the green “+” sign in the last column. A new box will pop up for you to define the variable.

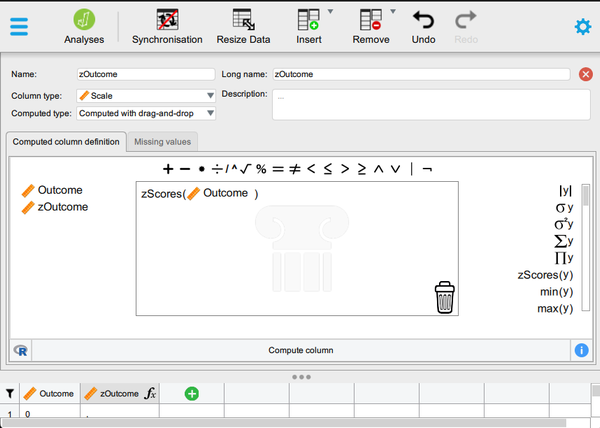
Computing Standardized Scores
-
Type in the new you wish to give the new variable (here it is “zOutcome”). Hit “Enter” to be sure the rest of the cells populate.
-
For “Computed Type”, be sure to select “Computed with Drag and Drop”.
-
In the tab labeled “Computed Column Definition”, click on “zScores(y)” on the right. Drag your original variable (here “Outcome”) to take the place of the “y” variable.
-
Click on “Compute Column” to finalize the data transformation.
-
To hide the setup menu, click on the large red “X”.
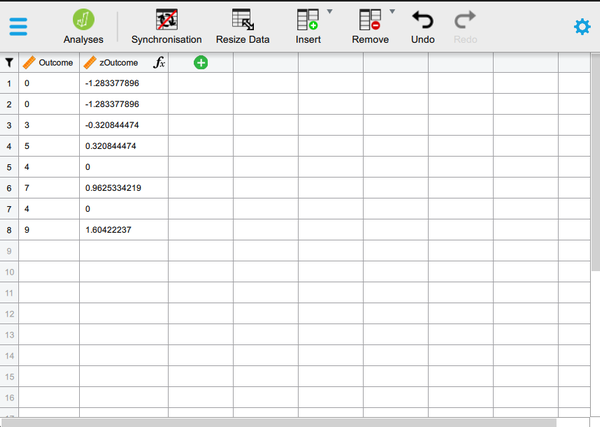
Viewing Standardized Scores
-
Note that standardized variables are not included in the output. Rather, they are saved as new variables in the data view window.
-
These variables can be used in subsequent analyses. You can follow the previous tutorials to get descriptive statistics for these variables.