JASP Articles
Data Analysis | One Sample t Test
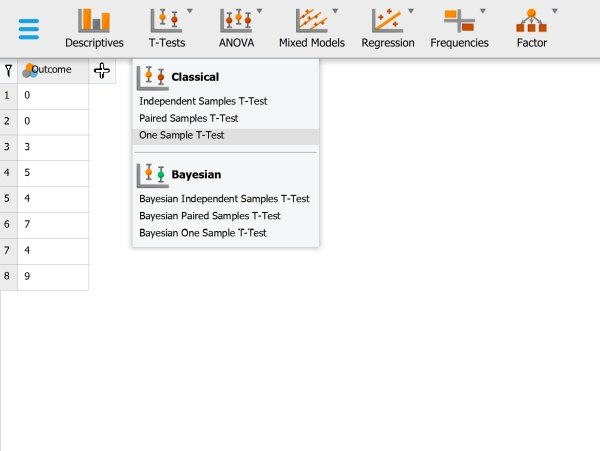
Selecting the Analysis
-
First, enter the data (described elsewhere).
-
In the “Analyses” section of the menu, select the “T-Tests → One Sample T-Test” option.
Obtaining Inferential Statistics
-
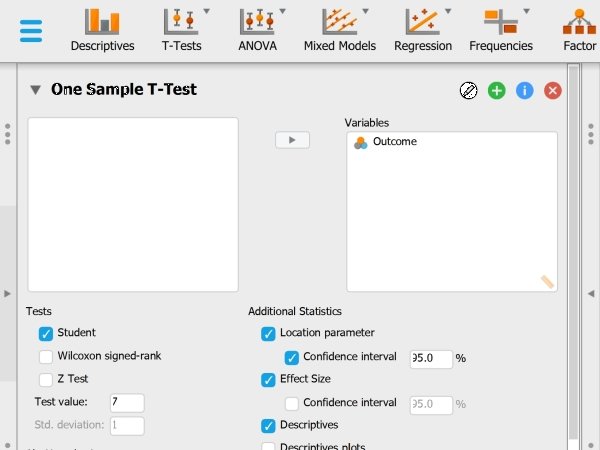
A set of options will then appear for you to choose the variables and statistics of interest.
-
Select the variable you wish to analyze by clicking on it in the left-hand box and then the arrow to move it into the right-hand box.
-
Be sure to enter a known or hypothesized mean into the “Test Value” field. If you do not enter a value here, JASP will automatically use zero as the comparison mean.
-
Output will automatically appear on the right side of the window.
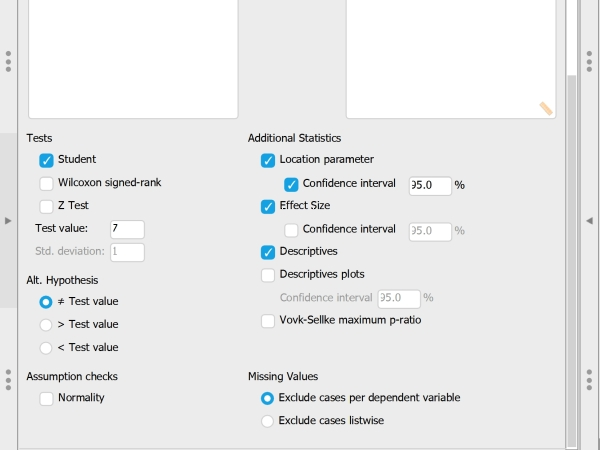
Obtaining Additional Statistics
-
Select the options that are important for you: “Location parameter” will display the size of the difference between the two means; “Effect size” will display Cohen’s d; and “Descriptives” will offer a mean and standard deviation for the group.
-
If you wish to view (and alter) the widths of the confidence intervals, check the relevant “Confidence Interval” boxes.
-
Updated output will automatically appear on the right side of the window.