jamovi Articles
Data Analysis | Confidence Interval for a Mean
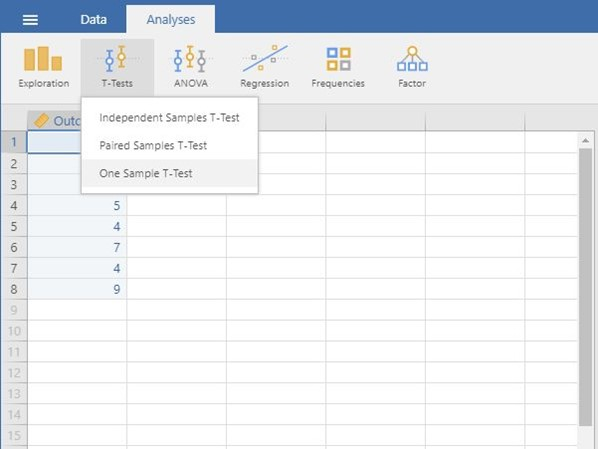
Selecting the Analysis
-
First, enter the data (described elsewhere).
-
On the “Analysis” tab, select the “T-Tests -> One Sample T-Test” option.
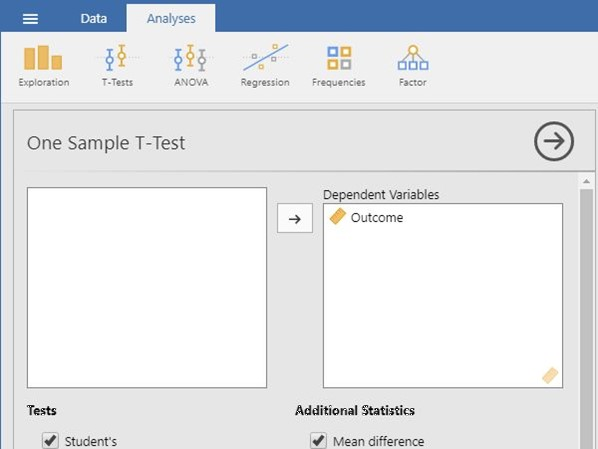
Choosing Variables
-
A set of options will then appear for you to choose the variables and statistics of interest.
-
Select the variable you wish to analyze by clicking on it in the left-hand box and then the arrow to move it into the right-hand box.
-
Output will automatically appear on the right side of the window.
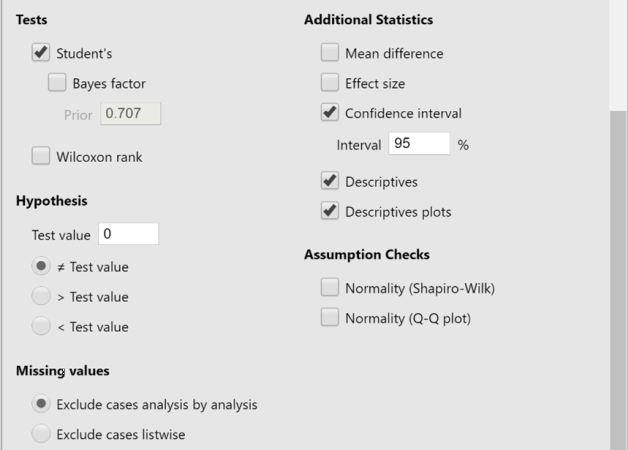
Obtaining Inferential Statistics
-
To get the confidence interval for the mean, make sure the “Test Value” is set to zero.
-
Check the “Confidence Interval” box (and alter the width of the interval if desired).
-
Similarly, select other options that are important for you: “Descriptives” will offer a mean and standard deviation for the variable; and “Descriptives plots” will provide a graph of the confidence interval.
-
Updated output will automatically appear on the right side of the window.