SPSS Articles
Data Analysis | Independent Samples t Test
Selecting the Analysis
-
First, enter two sample data (described elsewhere).
-
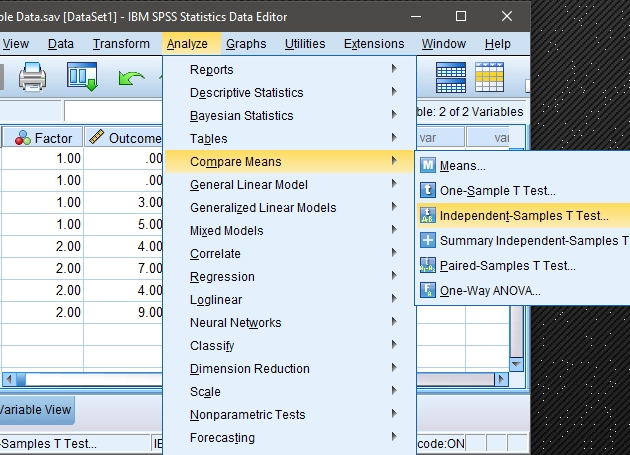
After the data are entered, select the “Analyze → Compare Means → Independent-Samples T Test” ption from the main menu.

Obtaining Inferential Statistics
-
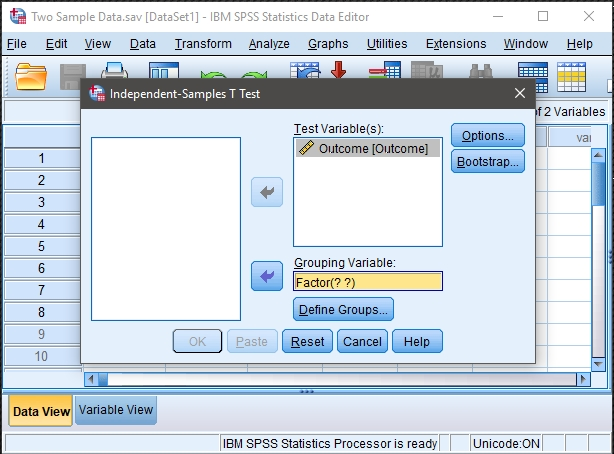
A dialogue box will then appear for you to choose the variables of interest.
-
Select the outcome variables you wish to analyze by clicking on them and hitting the arrow to move them into the “Test Variables” box.
-
Check the “Estimate effect size” to get Cohen’s d.
-
Move the variable that defines the different groups to the “Grouping Variable” box. Note that question marks will appear here and that you will need to follow the next set of steps in order to run the analyses.

Defining the Groups to be Analyzed
-
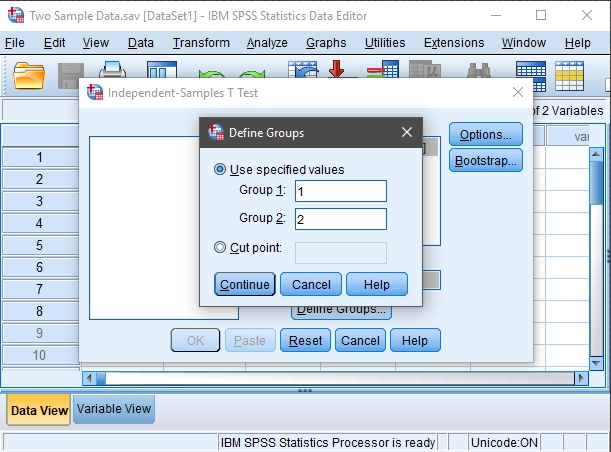
In order to tell SPSS which two groups you wish to compare, click on the “Define Groups” box.
-
A new dialog box will appear. Here you will need to indicate the numeric values you used in setting up the data file to refer to the groups. In this example, a value of 1 for the variable “group” referred to Group 1 and a value of 2 for the variable “group” referred to Group 2.
-
When you are done, click “Continue.” This will return you to the original dialogue box.
-
If you do not wish to alter the default (95%) confidence level, click “OK.” A separate window with the output will appear.

Altering the Confidence Interval
-
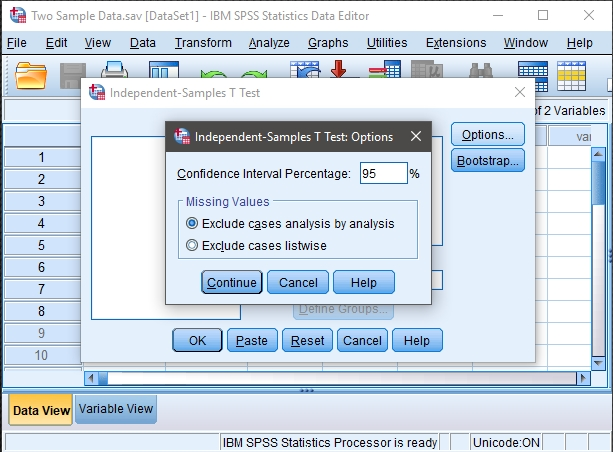
If you wish to alter the width of the confidence interval, select the “Options” button.
-
Another dialogue box will appear where you can change the confidence level. When you are done, click “Continue.” This will return you to the original dialogue box.
-
After clicking on “OK” in the original dialogue box, a separate window with the output will appear.

Intro Articles
SPSS Articles
- Data Entry | Two and Multiple Sample Data
- Data Analysis | Independent Samples t Test
- Annotated Output | Independent Samples t Test