SPSS Articles
Annotated Output | Regression
Computer Output
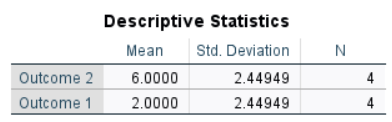
The table of descriptive statistics can be used to assist in calculating the correlation.
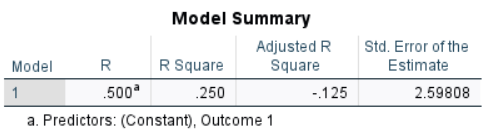
The tables of inferential statistics show the key elements to be calculated.
Calculations
Descriptive Statistics: The descriptive statistics are calculated separately for each variable.
Sum of Cross Products: The Sum of Cross Products (SCP) is not easily determined solely from the summary statistics of the output, but rather from the data.
\[SCP = \sum ( X - M_X ) ( Y - M_Y ) = ( 0 - 2.000 ) ( 4 - 6.000 ) + ( 0 - 2.000 )( 7 - 6.000 ) + ( 3 - 2.000 )( 4 - 6.000 ) + (5 - 2.000)(9 - 6.000) = 9.000\]
Covariance: The Covariance is a function of the Sum of Cross Products and the sample size:
\[COV = \frac{SCP}{(N - 1)} = \frac{9.000}{(4 - 1)} = 3.000\]
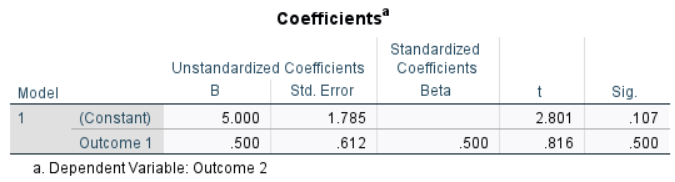
Unstandardized Regression Coefficients: The Unstandardized Regression Coefficients involve Covariance, the Standard Deviations of the variables, and the Means of the variables:
\[B_1 = \frac{COV}{(SD)^2} = \frac{3.000}{(2.449)^2} = 0.500\]
\[B_0 = M_Y - (B_1)(M_X) = 6.000 - (0.500)(2.000) = 5.000\]
Standardized Regression Coefficients: The Standard Regression Coefficients involve the Regression Coefficient (for the predictor) and the Standard Deviations of the variables:
\[\beta_1 = (B_1)\frac{SD_X}{SD_Y} = (0.500)\frac{2.449}{2.449} = 0.500\]
Multiple Correlation: In bivariate regression, the Multiple Correlation is the same as the bivariate Correlation:
\[r = \frac{COV}{(SD_X) (SD_Y)} = \frac{3.000}{(2.449) (2.449)} = .500\]
Proportion of Variance Accounted For: The Proportion of Variance Accounted For is a function of the Correlation:
\[R^2 = .0500^2 = 0.250\]
APA Style
Regression cofficients provide a measure of statistical relationship between two variables.
For the participants (N = 4), the scores on Outcome 1 (M = 2.00, SD = 2.45) moderately predicted Outcome 2 (M = 6.00, SD = 2.45), β = .500, R2= .250.
Note that regression coefficients can also have inferential information associated with them (and that this information should be summarized if it is available and of interest).
For the participants (N = 4), the scores on Outcome 1 (M = 2.00, SD = 2.45) did not significantly predict Outcome 2 (M = 6.00, SD = 2.45), β = .500, t = 0.816, p = .500.