SPSS Articles
Annotated Output | Correlations
Computer Output
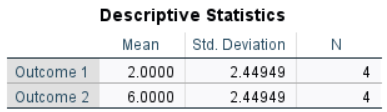
The table of descriptive statistics can be used to assist in calculating the correlation.
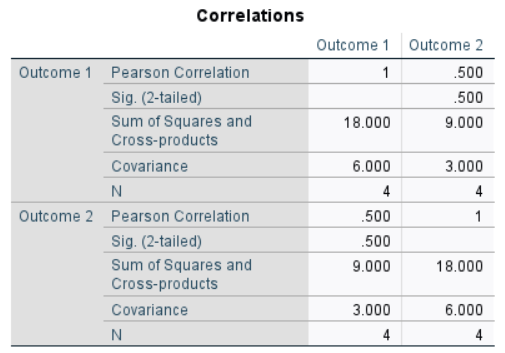
The table of inferential statistics shows the key elements to be calculated.
Calculations
Descriptive Statistics: The descriptive statistics are calculated separately for each variable.
Sum of Cross Products: The Sum of Cross Products (“SCP”) is not easily determined solely from the summary statistics of the output, but rather from the data.
\[SCP = \sum ( X - M_X ) ( Y - M_Y ) = ( 0 - 2.000 ) ( 4 - 6.000 ) + ( 0 - 2.000 )( 7 - 6.000 ) + ( 3 - 2.000 )( 4 - 6.000 ) + (5 - 2.000)(9 - 6.000) = 9.000\]
Covariance: The Covariance (“COV”) is a function of the Sum of Cross Products and the sample size:
\[COV = \frac{SCP}{(N - 1)} = \frac{9.000}{(4 - 1)} = 3.000\]
Pearson Correlation Coefficient: The Pearson Correlation Coefficient (“r”) is a function of the Covariance and the Standard Deviations of both variables:
\[r = \frac{COV}{(SD_X) (SD_Y)} = \frac{3.000}{(2.449) (2.449)} = .500\]
APA Style
Correlations provide a measure of statistical relationship between two variables.
For the participants (N = 4), the scores on Outcome 1 (M = 2.00, SD = 2.45) and Outcome 2 (M = 6.00, SD = 2.45) were moderately correlated, r(2) = .50.
Note that correlations can also have inferential information associated with them (and that this information should be summarized if it is available and of interest).
For the participants (N = 4), the scores on Outcome 1 (M = 2.00, SD = 2.45) and Outcome 2 (M = 6.00, SD = 2.45) were moderately but not statistically significantly correlated, r(2) = .50, 95% CI [-0.89, 0.99], p = .500.
Intro Articles
SPSS Articles
- Data Entry | Paired and Repeated Measures Data
- Data Analysis | Correlations
- Annotated Output | Correlations