JASP Articles
Annotated Output | Mixed ANOVA
Computer Output
The table of descriptive statistics provides the baseline information.
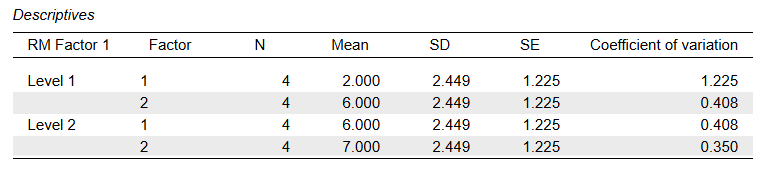
The descriptive statistics are calculated separately for each group and time point. They are not equivalent to getting the statistics for the variable(s) as a whole.
The table of inferential statistics shows the key elements to be interpreted.
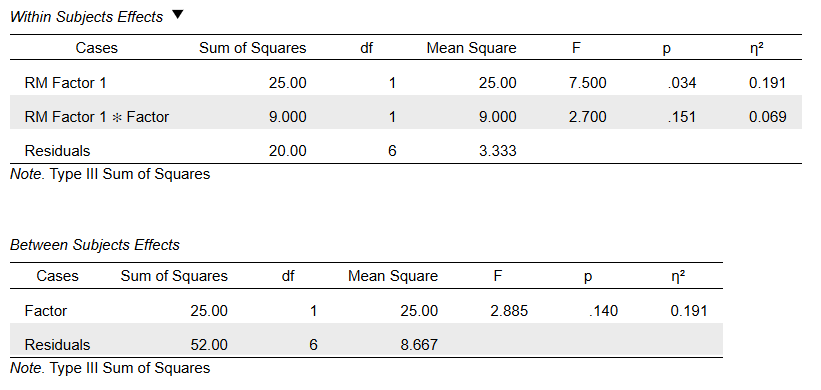
For the Factor Main Effect, F = 2.885, p = .140. This would not be considered a statistically significant finding.
For the Time Main Effect, F = 7.500, p = .034. This would be considered a statistically significant finding.
For the Interaction, F = 2.700, p = .152. This would not be considered a statistically significant finding.
For the Factor Main Effect, partial eta2 = 0.325. Thus, 32.5% of the variability among the scores is accounted for by Factor.
For the Time Main Effect, partial eta2 = 0.556. Thus, 55.6% of the variability among the scores is accounted for by Time.
For the Interaction, partial eta2 = 0.310. Thus, 31.0% of the variability among the scores is accounted for by the Factor × Time interaction.
For Mixed ANOVA, the confidence intervals around (centered on) each mean are appropropriate but not provided in the output.
APA Style
The mixed ANOVA provides statistics for the main effects and interaction in a mixed design. Each effect would be summarized in a style analogous to a Factorial ANOVA.
A 2 (Factor) × 2 (Time) mixed ANOVA showed that the small main effect of Factor was not statistically significant, F(1,6) = 2.89, p = .140, partial η2 = .33, nor was the moderately sized interaction, F(1,6) = 2.70, p = .152, partial η2 = .31. However, the large main effect of Time was statistically significant, F(1,6) = 7.50, p = .034, partial η2 = .56.
Typically, the means, standard deviations, and confidence intervals would be presented in a table or figure associated with this text.