CREATE Articles
Data Analysis | Post Hoc Comparisons
Entering the Data
-
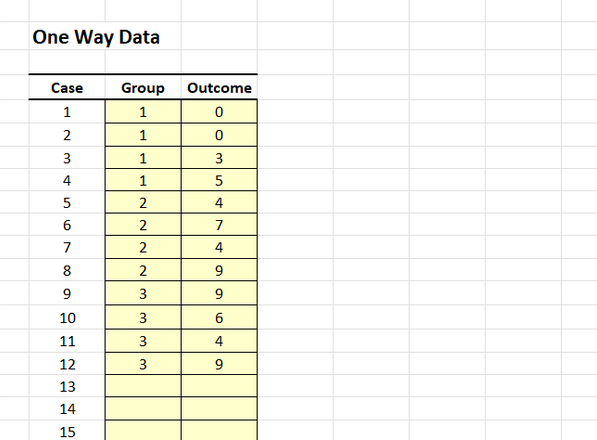
From the available tabs, select “OneWay”.
-
On the left side, you will be able to enter the data in the shaded cells.
-
Enter the data for all the participants. Notice that each participant has scores on both the Group and Outcome Variables. There will be as many rows as people.
-
On the categorical Group variable, you will use numbers to represent the multiple categories (or “levels”) of the variable.
Obtaining Descriptive and Inferential Statistics
-
Output will automatically appear on the right side of the tab.
-
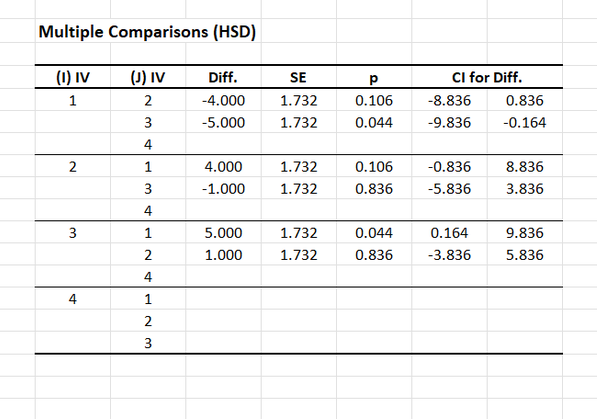
If you wish to alter the confidence intervals for the means and post hoc comparisons, enter the preferred confidence level in the shaded cell after “CI %”.